OH DEER LAB
1. Name three essential components of habitat (things animals need to survive).
A. Food
B. Water
C. Shelter
2. Explain what caused the increase of “deer” during the activity you participated in.
There was enough resources to increase the fertility rate.
3. Explain what caused the decrease of “deer” during the activity you participated in.
Too much resources were used and there was not enough for everybody in the end.
4. Define the term limiting factor. Give examples of limiting factors for the deer in our activity.
Limiting factor is a certain part of an ecosystem that controls population growth. Some examples of limiting factors are food, water, and shelter.
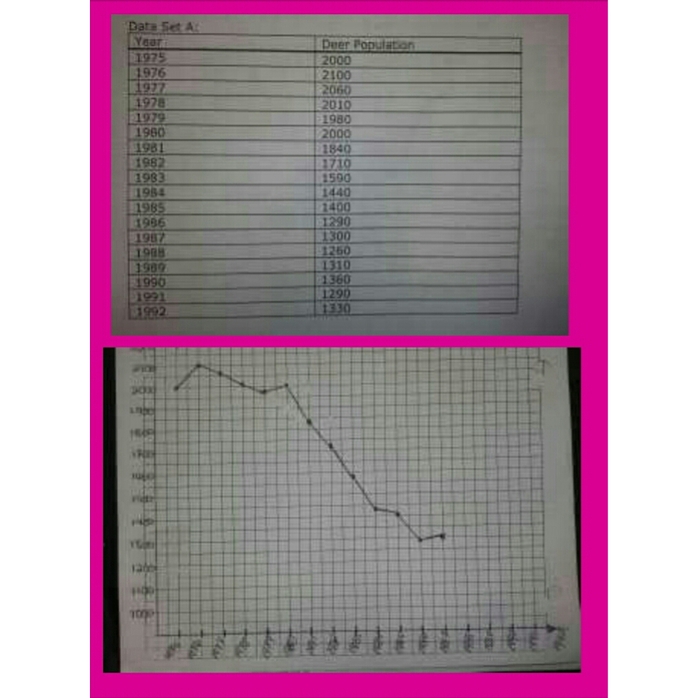
5. Graph the data from the activity and attach to this sheet (make sure to correctly title and label the axes). Describe what the graph of our data looks like. How and why did our deer population change?
The graph has a population growth but right after everything starts going down hill. The population dropped probably because they ran out of resources to sustain life.
6. Often we use the phrase “balance of nature” to describe a healthy ecosystem. Based on our graph, what does the “balance of nature” look like? Should we expect populations to be static (unchanging) or do they naturally fluctuate? Explain.
Based on our graph "balance of nature" really doesn't apply because the population just drops it does not naturally fluctuate. Maybe if we handled the resources better we could have set it on the right path.
7. What did you learn about population dynamics by doing this activity?
I learned that theirs a lot of factors that contribute to population dynamics and that population naturally fluctuates.
1. Name three essential components of habitat (things animals need to survive).
A. Food
B. Water
C. Shelter
2. Explain what caused the increase of “deer” during the activity you participated in.
There was enough resources to increase the fertility rate.
3. Explain what caused the decrease of “deer” during the activity you participated in.
Too much resources were used and there was not enough for everybody in the end.
4. Define the term limiting factor. Give examples of limiting factors for the deer in our activity.
Limiting factor is a certain part of an ecosystem that controls population growth. Some examples of limiting factors are food, water, and shelter.
5. Graph the data from the activity and attach to this sheet (make sure to correctly title and label the axes). Describe what the graph of our data looks like. How and why did our deer population change?
The graph has a population growth but right after everything starts going down hill. The population dropped probably because they ran out of resources to sustain life.
6. Often we use the phrase “balance of nature” to describe a healthy ecosystem. Based on our graph, what does the “balance of nature” look like? Should we expect populations to be static (unchanging) or do they naturally fluctuate? Explain.
Based on our graph "balance of nature" really doesn't apply because the population just drops it does not naturally fluctuate. Maybe if we handled the resources better we could have set it on the right path.
7. What did you learn about population dynamics by doing this activity?
I learned that theirs a lot of factors that contribute to population dynamics and that population naturally fluctuates.
pic borrowed from VIC!!!!!!!
